.png?width=1600&height=1000&name=AI-powered%20set%20up%20and%20analysis%20(3).png)


The easiest way to see your product portfolio evolve over time
-1.png?width=600&height=587&name=Homepage%20product%20mockup%20(1)-1.png)

Track prototype evolution
A CPG brand tests three iterations of a new snack product. They create a comparison showing how consumer perception of taste, packaging, and purchase intent evolved from Version 1 to Version 3, identifying which specific improvements drove the biggest gains.

Uncover what drives affinity across product lines
A consumer electronics company tests multiple products across categories (headphones, speakers, earbuds). They create a comparison of Net Promoter Scores, value perception, and key attributes to identify what drives satisfaction across their entire product portfolio.

Monitor competitive performance over time
A beauty brand tests their products against competitors each quarter. They create a running comparison showing how their products perform against the competitive set, identifying when competitors launch strong alternatives, and when they have market advantages.

Understand your consumer segments
A food brand tests the same product with different segments across multiple projects (Gen Z consumers, health-conscious shoppers, budget shoppers), comparing how the same product performs across these different groups, informing targeting and positioning strategy.

Seamlessly report to execs and other stakeholders
A VP of Product Development at a footwear brand has tested several different sneaker lines and iterations over time, and wants to show their CEO the breadth of testing run and key insights across athlete research. They share cross-project insights quickly and easily with their executives with Scorecards highlighting winners and losers for priority KPIs.

Optimize your retail assortment with shopper data
A category manager running merchandising for the supplement aisle wants to identify the most innovative and effective products to stock. They ask potential suppliers for Highlight research assessing fit for their consumer set. The category manager can then stack rank products by fit and make better, data-driven merchandising decisions.
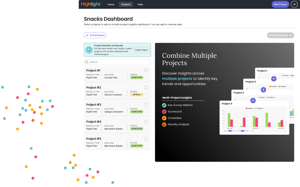
Make confident decisions based on connected historical data
Unlike traditional survey platforms that treat each survey as an isolated data set, Highlight’s multi-project dashboards make comparison across projects and over time as easy as ticking a box. Select the products and surveys you want to collate, and Highlight automatically does the mapping and matching, so you can skip the manual data exports and spreadsheet manipulation.
See how Unilever has built better products with Highlight
Highlight is already helping Unilever teams accelerate innovation, uncover new opportunities, and strengthen connections with their customers.
Curious to see the behind-the-scenes stories? Internal testimonials are available exclusively to Unilever teams. Contact us to learn more!
.png?width=302&height=129&name=GET%20TESTIMONIAL%20(4).png)
.png?width=1600&height=1000&name=Unilever%20ABM%20LP%20Image%20(3).png "Unilever ABM LP Image (3)")
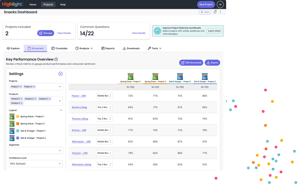
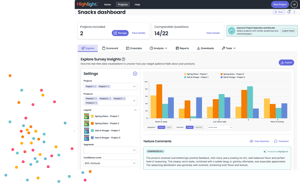
Get strategic insights that single-project analysis can't reveal
With a unified view of your research, you can view your data as a Scorecard across selected projects, use Crosstabs to make comparisons with proper statistical significance, and even generate PDF reports to show cross-project comparisons. Manage secure access with permission validation and team-based visibility controls to ensure the right level of access for all eyes.